5. Pandas高级教程之:Dataframe的重排和旋转
简介
使用Pandas的pivot方法可以将DF进行旋转变换,本文将会详细讲解pivot的秘密。
使用Pivot
pivot用来重组DF,使用指定的index,columns和values来对现有的DF进行重构。
看一个Pivot的例子:
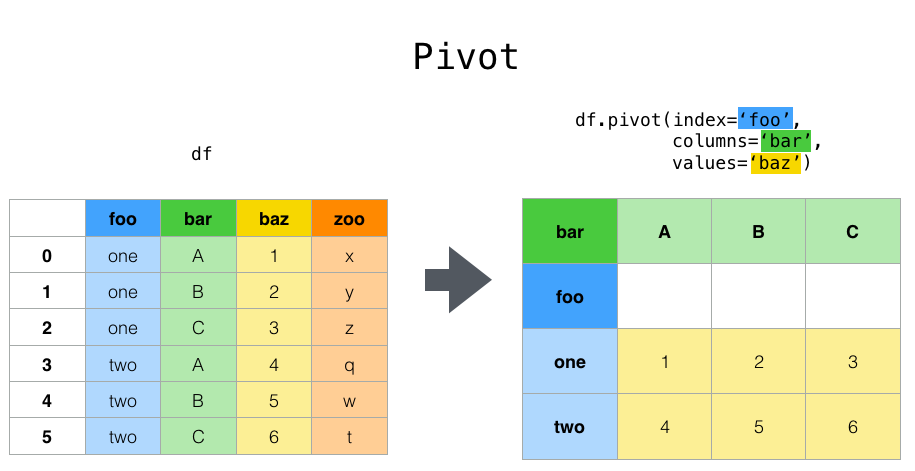
通过pivot变化,新的DF使用foo中的值作为index,使用bar的值作为columns,zoo作为对应的value。
再看一个时间变化的例子:
In [1]: df
Out[1]:
         date variable     value
0  2000-01-03        A  0.469112
1  2000-01-04        A -0.282863
2  2000-01-05        A -1.509059
3  2000-01-03        B -1.135632
4  2000-01-04        B  1.212112
5  2000-01-05        B -0.173215
6  2000-01-03        C  0.119209
7  2000-01-04        C -1.044236
8  2000-01-05        C -0.861849
9  2000-01-03        D -2.104569
10 2000-01-04        D -0.494929
11 2000-01-05        D  1.071804
In [3]: df.pivot(index='date', columns='variable', values='value')
Out[3]:
variable           A         B         C         D
date
2000-01-03  0.469112 -1.135632  0.119209 -2.104569
2000-01-04 -0.282863  1.212112 -1.044236 -0.494929
2000-01-05 -1.509059 -0.173215 -0.861849  1.071804
如果剩余的value,多于一列的话,每一列都会有相应的columns值:
In [4]: df['value2'] = df['value'] * 2

In [5]: pivoted = df.pivot(index='date', columns='variable')

In [6]: pivoted
Out[6]:
               value                                  value2
variable           A         B         C         D         A         B         C         D
date
2000-01-03  0.469112 -1.135632  0.119209 -2.104569  0.938225 -2.271265  0.238417 -4.209138
2000-01-04 -0.282863  1.212112 -1.044236 -0.494929 -0.565727  2.424224 -2.088472 -0.989859
2000-01-05 -1.509059 -0.173215 -0.861849  1.071804 -3.018117 -0.346429 -1.723698  2.143608
通过选择value2,可以得到相应的子集:
In [7]: pivoted['value2']
Out[7]:
variable           A         B         C         D
date
2000-01-03  0.938225 -2.271265  0.238417 -4.209138
2000-01-04 -0.565727  2.424224 -2.088472 -0.989859
2000-01-05 -3.018117 -0.346429 -1.723698  2.143608
使用Stack
Stack是对DF进行转换,将列转换为新的内部的index。
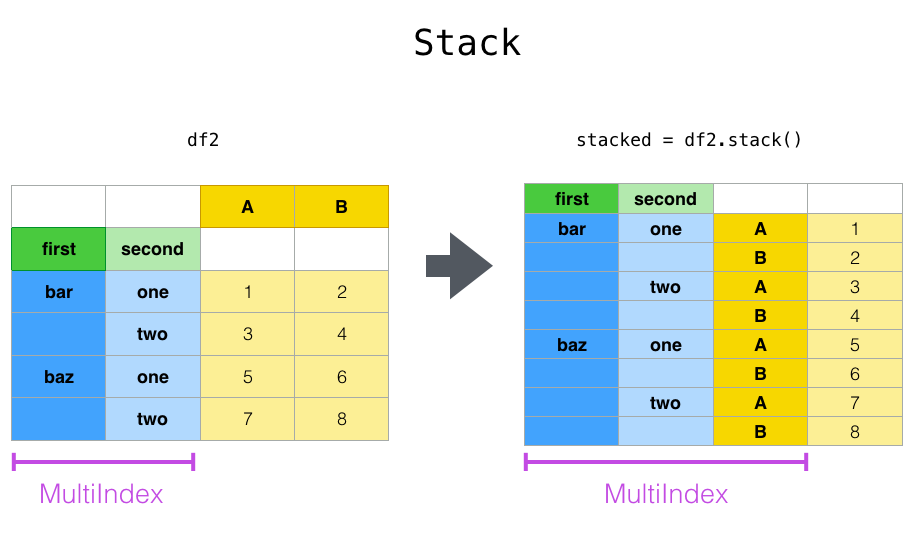
上面我们将列A,B转成了index。
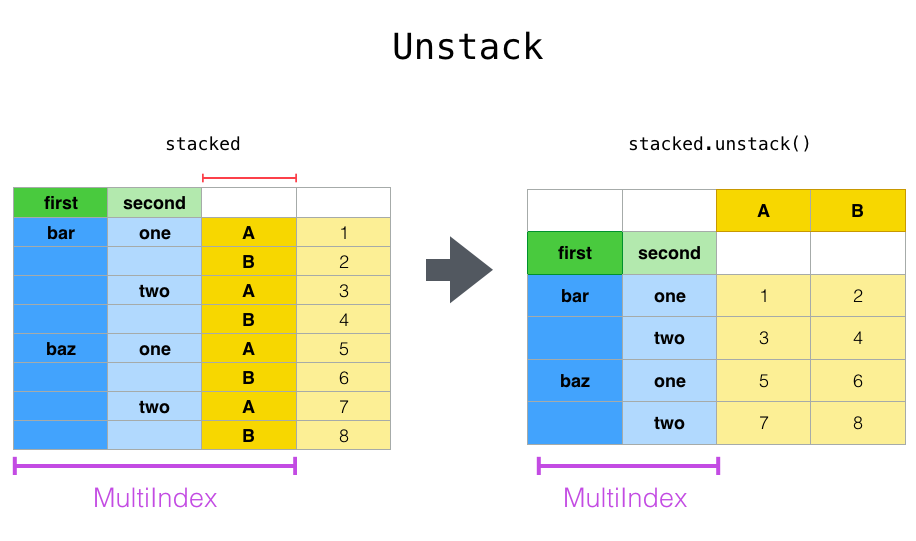
unstack是stack的反向操作,是将最内层的index转换为对应的列。
举个具体的例子:
In [8]: tuples = list(zip(*[['bar', 'bar', 'baz', 'baz',
   ...:                      'foo', 'foo', 'qux', 'qux'],
   ...:                     ['one', 'two', 'one', 'two',
   ...:                      'one', 'two', 'one', 'two']]))
   ...:

In [9]: index = pd.MultiIndex.from_tuples(tuples, names=['first', 'second'])

In [10]: df = pd.DataFrame(np.random.randn(8, 2), index=index, columns=['A', 'B'])

In [11]: df2 = df[:4]

In [12]: df2
Out[12]:
                     A         B
first second
bar   one     0.721555 -0.706771
      two    -1.039575  0.271860
baz   one    -0.424972  0.567020
      two     0.276232 -1.087401
In [13]: stacked = df2.stack()

In [14]: stacked
Out[14]:
first  second
bar    one     A    0.721555
               B   -0.706771
       two     A   -1.039575
               B    0.271860
baz    one     A   -0.424972
               B    0.567020
       two     A    0.276232
               B   -1.087401
dtype: float64
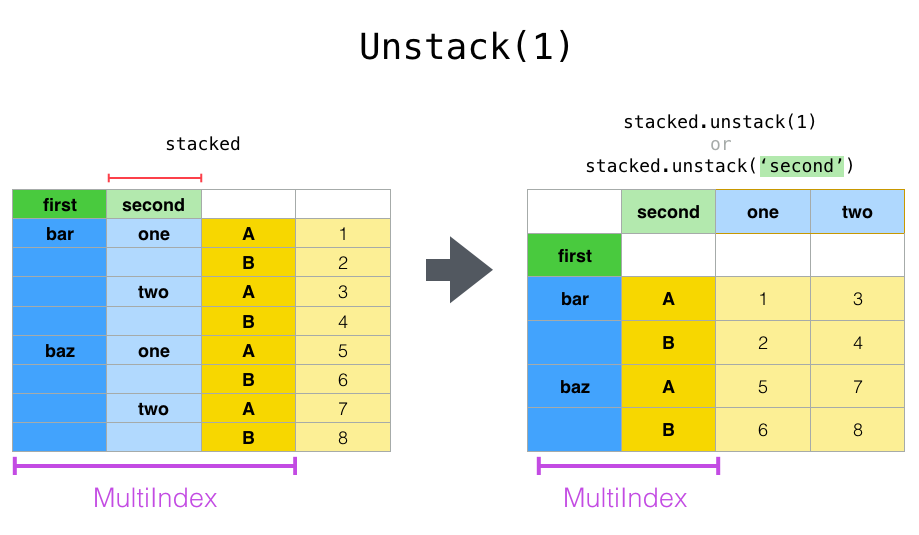
默认情况下unstack是unstack最后一个index,我们还可以指定特定的index值:
In [15]: stacked.unstack()
Out[15]:
                     A         B
first second
bar   one     0.721555 -0.706771
      two    -1.039575  0.271860
baz   one    -0.424972  0.567020
      two     0.276232 -1.087401

In [16]: stacked.unstack(1)
Out[16]:
second        one       two
first
bar   A  0.721555 -1.039575
      B -0.706771  0.271860
baz   A -0.424972  0.276232
      B  0.567020 -1.087401

In [17]: stacked.unstack(0)
Out[17]:
first          bar       baz
second
one    A  0.721555 -0.424972
       B -0.706771  0.567020
two    A -1.039575  0.276232
       B  0.271860 -1.087401
默认情况下stack只会stack一个level,还可以传入多个level:
In [23]: columns = pd.MultiIndex.from_tuples([
   ....:     ('A', 'cat', 'long'), ('B', 'cat', 'long'),
   ....:     ('A', 'dog', 'short'), ('B', 'dog', 'short')],
   ....:     names=['exp', 'animal', 'hair_length']
   ....: )
   ....:

In [24]: df = pd.DataFrame(np.random.randn(4, 4), columns=columns)

In [25]: df
Out[25]:
exp                 A         B         A         B
animal            cat       cat       dog       dog
hair_length      long      long     short     short
0            1.075770 -0.109050  1.643563 -1.469388
1            0.357021 -0.674600 -1.776904 -0.968914
2           -1.294524  0.413738  0.276662 -0.472035
3           -0.013960 -0.362543 -0.006154 -0.923061

In [26]: df.stack(level=['animal', 'hair_length'])
Out[26]:
exp                          A         B
  animal hair_length
0 cat    long         1.075770 -0.109050
  dog    short        1.643563 -1.469388
1 cat    long         0.357021 -0.674600
  dog    short       -1.776904 -0.968914
2 cat    long        -1.294524  0.413738
  dog    short        0.276662 -0.472035
3 cat    long        -0.013960 -0.362543
  dog    short       -0.006154 -0.923061
上面等价于:
In [27]: df.stack(level=[1, 2])
使用melt
melt指定特定的列作为标志变量,其他的列被转换为行的数据。并放置在新的两个列:variable和value中。
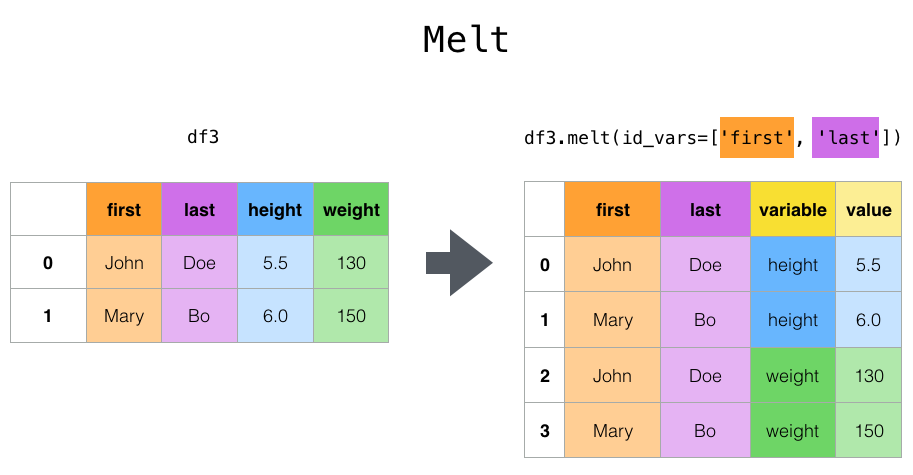
上面例子中我们指定了两列first和last,这两列是不变的,height和weight被变换成为行数据。
举个例子:
In [41]: cheese = pd.DataFrame({'first': ['John', 'Mary'],
   ....:                        'last': ['Doe', 'Bo'],
   ....:                        'height': [5.5, 6.0],
   ....:                        'weight': [130, 150]})
   ....:

In [42]: cheese
Out[42]:
  first last  height  weight
0  John  Doe     5.5     130
1  Mary   Bo     6.0     150

In [43]: cheese.melt(id_vars=['first', 'last'])
Out[43]:
  first last variable  value
0  John  Doe   height    5.5
1  Mary   Bo   height    6.0
2  John  Doe   weight  130.0
3  Mary   Bo   weight  150.0

In [44]: cheese.melt(id_vars=['first', 'last'], var_name='quantity')
Out[44]:
  first last quantity  value
0  John  Doe   height    5.5
1  Mary   Bo   height    6.0
2  John  Doe   weight  130.0
3  Mary   Bo   weight  150.0
使用Pivot tables
虽然Pivot可以进行DF的轴转置,Pandas还提供了 pivot_table() 在转置的同时可以进行数值的统计。
pivot_table() 接收下面的参数:
data: 一个df对象
values:一列或者多列待聚合的数据。
Index: index的分组对象
Columns: 列的分组对象
Aggfunc: 聚合的方法。
先创建一个df:
In [59]: import datetime

In [60]: df = pd.DataFrame({'A': ['one', 'one', 'two', 'three'] * 6,
   ....:                    'B': ['A', 'B', 'C'] * 8,
   ....:                    'C': ['foo', 'foo', 'foo', 'bar', 'bar', 'bar'] * 4,
   ....:                    'D': np.random.randn(24),
   ....:                    'E': np.random.randn(24),
   ....:                    'F': [datetime.datetime(2013, i, 1) for i in range(1, 13)]
   ....:                    + [datetime.datetime(2013, i, 15) for i in range(1, 13)]})
   ....:

In [61]: df
Out[61]:
        A  B    C         D         E          F
0     one  A  foo  0.341734 -0.317441 2013-01-01
1     one  B  foo  0.959726 -1.236269 2013-02-01
2     two  C  foo -1.110336  0.896171 2013-03-01
3   three  A  bar -0.619976 -0.487602 2013-04-01
4     one  B  bar  0.149748 -0.082240 2013-05-01
..    ... ..  ...       ...       ...        ...
19  three  B  foo  0.690579 -2.213588 2013-08-15
20    one  C  foo  0.995761  1.063327 2013-09-15
21    one  A  bar  2.396780  1.266143 2013-10-15
22    two  B  bar  0.014871  0.299368 2013-11-15
23  three  C  bar  3.357427 -0.863838 2013-12-15

[24 rows x 6 columns]
下面是几个聚合的例子:
In [62]: pd.pivot_table(df, values='D', index=['A', 'B'], columns=['C'])
Out[62]:
C             bar       foo
A     B
one   A  1.120915 -0.514058
      B -0.338421  0.002759
      C -0.538846  0.699535
three A -1.181568       NaN
      B       NaN  0.433512
      C  0.588783       NaN
two   A       NaN  1.000985
      B  0.158248       NaN
      C       NaN  0.176180

In [63]: pd.pivot_table(df, values='D', index=['B'], columns=['A', 'C'], aggfunc=np.sum)
Out[63]:
A       one               three                 two
C       bar       foo       bar       foo       bar       foo
B
A  2.241830 -1.028115 -2.363137       NaN       NaN  2.001971
B -0.676843  0.005518       NaN  0.867024  0.316495       NaN
C -1.077692  1.399070  1.177566       NaN       NaN  0.352360

In [64]: pd.pivot_table(df, values=['D', 'E'], index=['B'], columns=['A', 'C'],
   ....:                aggfunc=np.sum)
   ....:
Out[64]:
          D                                                           E
A       one               three                 two                 one               three                 two
C       bar       foo       bar       foo       bar       foo       bar       foo       bar       foo       bar       foo
B
A  2.241830 -1.028115 -2.363137       NaN       NaN  2.001971  2.786113 -0.043211  1.922577       NaN       NaN  0.128491
B -0.676843  0.005518       NaN  0.867024  0.316495       NaN  1.368280 -1.103384       NaN -2.128743 -0.194294       NaN
C -1.077692  1.399070  1.177566       NaN       NaN  0.352360 -1.976883  1.495717 -0.263660       NaN       NaN  0.872482
添加margins=True会添加一个All列,表示对所有的列进行聚合:
In [69]: df.pivot_table(index=['A', 'B'], columns='C', margins=True, aggfunc=np.std)
Out[69]:
                D                             E
C             bar       foo       All       bar       foo       All
A     B
one   A  1.804346  1.210272  1.569879  0.179483  0.418374  0.858005
      B  0.690376  1.353355  0.898998  1.083825  0.968138  1.101401
      C  0.273641  0.418926  0.771139  1.689271  0.446140  1.422136
three A  0.794212       NaN  0.794212  2.049040       NaN  2.049040
      B       NaN  0.363548  0.363548       NaN  1.625237  1.625237
      C  3.915454       NaN  3.915454  1.035215       NaN  1.035215
two   A       NaN  0.442998  0.442998       NaN  0.447104  0.447104
      B  0.202765       NaN  0.202765  0.560757       NaN  0.560757
      C       NaN  1.819408  1.819408       NaN  0.650439  0.650439
All      1.556686  0.952552  1.246608  1.250924  0.899904  1.059389
使用crosstab
Crosstab 用来统计表格中元素的出现次数。
In [70]: foo, bar, dull, shiny, one, two = 'foo', 'bar', 'dull', 'shiny', 'one', 'two'

In [71]: a = np.array([foo, foo, bar, bar, foo, foo], dtype=object)

In [72]: b = np.array([one, one, two, one, two, one], dtype=object)

In [73]: c = np.array([dull, dull, shiny, dull, dull, shiny], dtype=object)

In [74]: pd.crosstab(a, [b, c], rownames=['a'], colnames=['b', 'c'])
Out[74]:
b    one        two
c   dull shiny dull shiny
a
bar    1     0    0     1
foo    2     1    1     0
crosstab可以接收两个Series:
In [75]: df = pd.DataFrame({'A': [1, 2, 2, 2, 2], 'B': [3, 3, 4, 4, 4],
   ....:                    'C': [1, 1, np.nan, 1, 1]})
   ....:

In [76]: df
Out[76]:
   A  B    C
0  1  3  1.0
1  2  3  1.0
2  2  4  NaN
3  2  4  1.0
4  2  4  1.0

In [77]: pd.crosstab(df['A'], df['B'])
Out[77]:
B  3  4
A
1  1  0
2  1  3
还可以使用normalize来指定比例值:
In [82]: pd.crosstab(df['A'], df['B'], normalize=True)
Out[82]:
B    3    4
A
1  0.2  0.0
2  0.2  0.6
还可以normalize行或者列:
In [83]: pd.crosstab(df['A'], df['B'], normalize='columns')
Out[83]:
B    3    4
A
1  0.5  0.0
2  0.5  1.0
可以指定聚合方法:
In [84]: pd.crosstab(df['A'], df['B'], values=df['C'], aggfunc=np.sum)
Out[84]:
B    3    4
A
1  1.0  NaN
2  1.0  2.0
get_dummies
get_dummies可以将DF中的一列转换成为k列的0和1组合:
df = pd.DataFrame({'key': list('bbacab'), 'data1': range(6)})

df
Out[9]:
   data1 key
0      0   b
1      1   b
2      2   a
3      3   c
4      4   a
5      5   b

pd.get_dummies(df['key'])
Out[10]:
   a  b  c
0  0  1  0
1  0  1  0
2  1  0  0
3  0  0  1
4  1  0  0
5  0  1  0
get_dummies 和 cut 可以进行结合用来统计范围内的元素:
In [95]: values = np.random.randn(10)

In [96]: values
Out[96]:
array([ 0.4082, -1.0481, -0.0257, -0.9884,  0.0941,  1.2627,  1.29  ,
        0.0824, -0.0558,  0.5366])

In [97]: bins = [0, 0.2, 0.4, 0.6, 0.8, 1]

In [98]: pd.get_dummies(pd.cut(values, bins))
Out[98]:
   (0.0, 0.2]  (0.2, 0.4]  (0.4, 0.6]  (0.6, 0.8]  (0.8, 1.0]
0           0           0           1           0           0
1           0           0           0           0           0
2           0           0           0           0           0
3           0           0           0           0           0
4           1           0           0           0           0
5           0           0           0           0           0
6           0           0           0           0           0
7           1           0           0           0           0
8           0           0           0           0           0
9           0           0           1           0           0
get_dummies还可以接受一个DF参数:
In [99]: df = pd.DataFrame({'A': ['a', 'b', 'a'], 'B': ['c', 'c', 'b'],
   ....:                    'C': [1, 2, 3]})
   ....:

In [100]: pd.get_dummies(df)
Out[100]:
   C  A_a  A_b  B_b  B_c
0  1    1    0    0    1
1  2    0    1    0    1
2  3    1    0    1    0
本文已收录于 www.flydean.com
最通俗的解读,最深刻的干货,最简洁的教程,众多你不知道的小技巧等你来发现!
欢迎关注我的公众号:「程序那些事」,懂技术,更懂你!
点我查看更多精彩内容:www.flydean.com